All of the most recent city rankings here. (Or, all years)
Technical method is comparable since 2018.
In 2021 year special adjustments for Covid were made, see FAQ
City rankings measuring pre-conditions for innovation in cities worldwide.
The basis of this is 162 indicators. The theory behind each Indicator is based on original studies, research, academic texts or commercial principles established in the market.
Innovation conditions are summarised using a 3 factor score derived from the 162 indicators. While a few indicators vary each year the process is the same since 2018, and largely the same since 2012. (With some improvements each year, which became substantive over time).
This score is aligned to a process of innovation. The process covers turning ideas into implemented and communicated innovations. The indicators measure this process of innovation creation - from idea conception/ideation to implementation/execution to marketing/communication/virality.
Scoring
Each of the indicators is scored with Benchmark Scores. The scores are done in accordance with our own benchmark guides (based on 500+ cities data) and algorithms within our model.
Being a broad-based index, these 162 indicators cover all 31 industry or government portfolios within a major city. In some cities these may be managed by private enterprise, in other cities by councils, in others by state or federal government. We look at outcomes, not management. Obviously, some indicators are better managed by various govt/industry actors than others.
For example, the Cafes & Tea Rooms indicators should ideally reflect numerous small to medium independent businesses. Whereas the Resources indicators will measure the outcome of large corporate activity or government monopolies. Oil & Gas indicator could be private or government or mixed.
Not a pure tech index
This means we are not examining purely tech, science or STEM innovation. Unlike other rankings.
Quantitative basis
The 162 indicators are in turn, derived from around 1000 data point variables selected from 2thinknow's City Benchmarking Data set (external site).
This commercial quality data is sold to business and others for investment decisions. (As well as being used and tested in the Index.)
Collectively, this is termed the Innovation Cities™ Index, the largest of its kind, established in 2007, expanded in 2010 and ongoingly converted to quantitative basis between 2012 and 2019. The majority of the Index is now driven by algorithms.
Additionally, learn more about Classifications and Benchmark Scores (external link), or current FAQ.
3 Factors in more detail
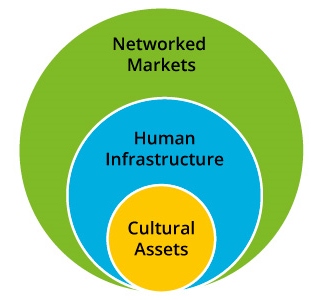
The 3 Factors can also be understood as measuring the cultural and environmental conditions for a process of innovation. i.e. Idea Generation, Idea Implementation and finally Communication to Others. In short, as innovation moves from idea to implementation and then, communication.
Cities in the Innovation Cities™ Index are scored for innovation on these 3 Factors:
 Cultural Assets: Measurable sources of ideas (e.g. designers, art galleries, sports, museums, dance, nature, etc)
Human Infrastructure: Soft and hard infrastructure to implement innovation (transport, universities, business, venture capital, office space, government, technology, etc.)
Networked Markets: Basic conditions and connections for innovation (location, tech, military, economies of related entities etc) - communication of innovation
These 3 Factors are based on 2thinknow’s extensive model of the stages of innovation process. Which in turn shares its roots with Design thinking, Lean, Agile and pre-cursor models of innovation and texts going back to the 1960s. Our specific data approach with its analytical models has been termed the 2thinknow Innovation Development Life Cycle (IDLC) model. We first drafted versions of this in 2006-7.
The 3 factors measure the conditions for turning an innovative idea into an implemented successful global (or regional) innovation.
In short, the model is based on ideas, implementation and communication with a 4th phase used to assess feasibility. Variations of this model have been published since the 2007 edition of our report, and delivered in our training and speeches.
> More on the 3 Factors
4 Innovation Classifications.
Based on their 3 factor score, all cities are graded into award categories. Please see the Classification explanation here.
Regions & Geographical Groupings.
The Innovation Cities™ Index results can be grouped by regions and groupings to find relative strengths and weaknesses within an area. Each region has several groupings for earlier years. These are as follows:
AMERICAS: USA, Canada and Latin America Groupings
EUROPE: Europe (includes Turkey etc), UK (now a separate Grouping) and Russia
ASIA: Asia, China, India, Japan and ANZ (Australia & NZ) Groupings
EMERGING: Mid-East, Africa, and Eurasia Groupings.
Note in 2023, we also use began use standard global groupings like E.U., G20, G8, ASEAN, NAFTA etc. This creates rankings comparable with various global trade and political groupings.
Index Methodology in brief. (Helpful if you are writing about it)
The Index is the most comprehensive city ranking and scoring.
Each city was originally selected from 1,700+ cities based on basic factors of health, wealth, population, geography as well as potential relative to peers. The final cities in 2019 had data extracted on 162 indicators under the City Benchmarking Data program.
Each of the benchmarking data was scored by analysts using best available qualitative analysis and quantitative statistics (see City Benchmarking Data to purchase city data).
Underlying data was then balanced against current global trends, by analysts to form a simplified 3 factor score for Cultural Assets, Human Infrastructure and Networked Markets. For city classification, these scores were competitively graded into 4 bands (Nexus, Hub, Node, Upstart) based on how broad based (multiple indicators) the city performance was. The top scored cities (top third) were allocated as Nexus and Hub were ranked by analysts based on comparison of current innovation potential. A Node classification is considered 'globally competitive'.
From this global Index of 500 cities, a variety of regional and geographical indexes are prepared covering the whole world in zones. These vary from year to year, but include Europe (including UK or excluding) rankings, Mid-East Rankings, etc. In 2023 they include rankings for the G8, G20, Asean, GCC, NAFTA and more. This helps researchers make sense of our world.
The ranking was completed on the scored and classified cities using 2thinknow trend analysis techniques. The trend assumptions used are outlined as 'Key Trends' in the Substack email each year before or after publication (replaces old report). Please note the full list on the index page is classified and ranked.
More
More discussion and questions answered in this extensive FAQ.
For more expansive details, subscribe to the new substack email newsletter which replaces the old PDF/print report.
Contact 2thinknow here: http://innovation-cities.com/enquire/
ANALYSIS

Our clients can make a case for innovation. They know higher rates of innovation mean more income, revenue, lower unemployment.
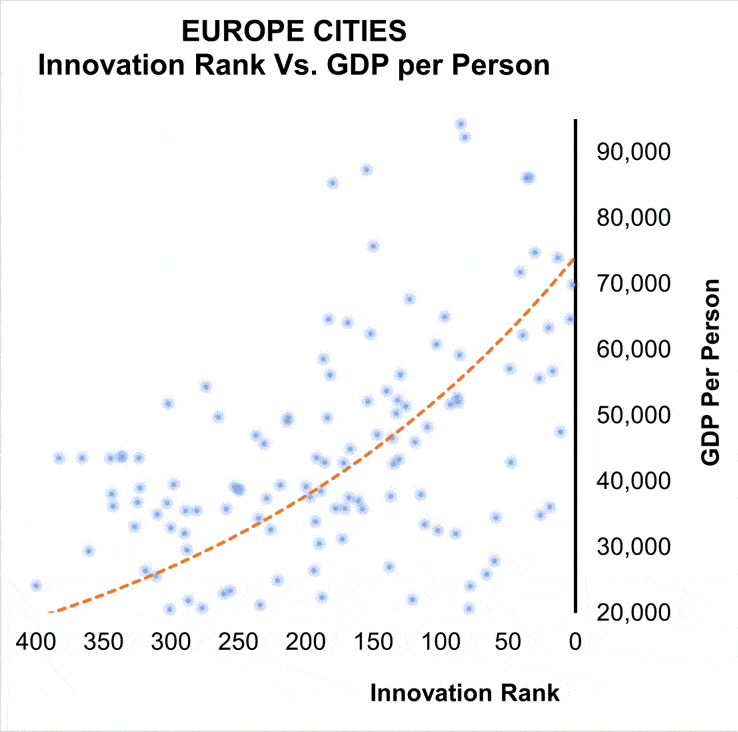
If you are looking to improve your economy, and fund social programs you care about, growth is the only answer. A higher rate of innovation in our Index correlates to much higher economic growth (higher rates of $GDP per capita for you economic geeks) over time.
Higher innovation rates also correlates to lower rates of unemployment. And if you could measure it, cities with higher rates of innovation are more dynamic.
If you want to understand and develop innovation, is the best way long academic theories? Asking a consultant? Yet another long change process? Tasking graduates who can use google?
In the Special Annual Package offer we share the tools & practical insights direct from 500 cities, studied since 2007 by 2thinknow. Insights you can start sharing right away!

